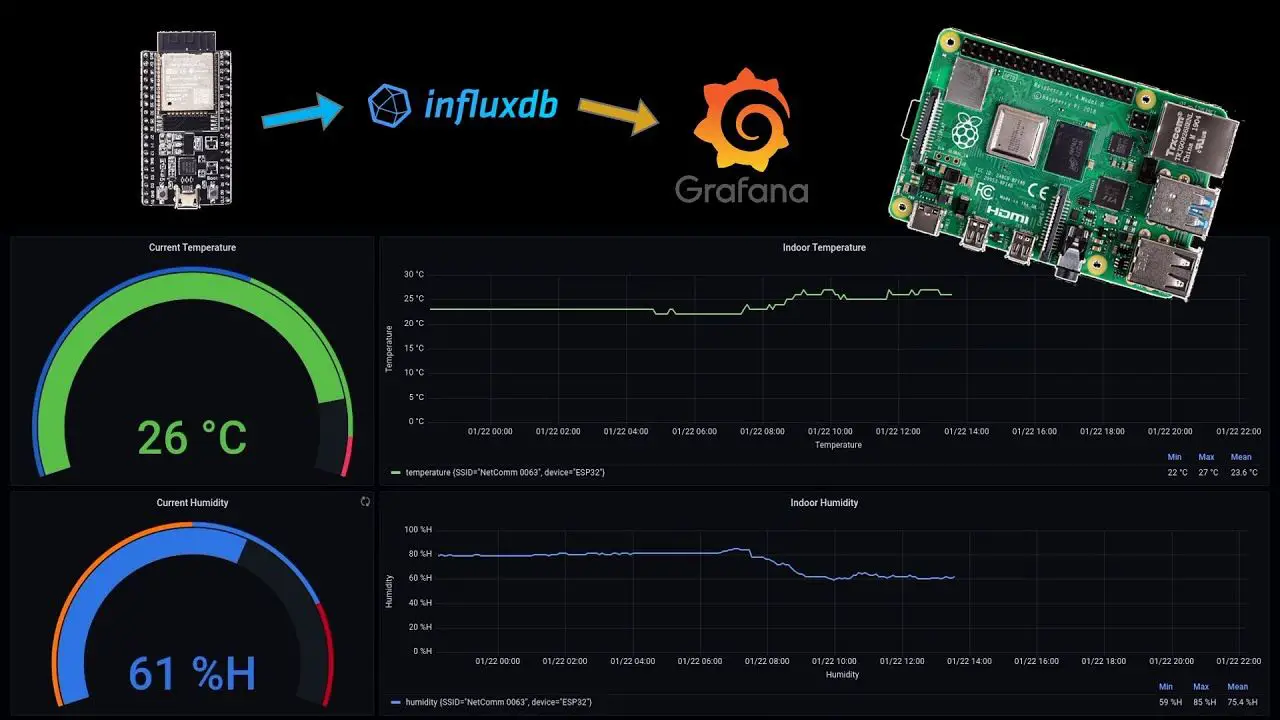
Following one of my previous projects where I built a weather station dashboard on the reTerminal, I had quite a few requests to do a more in-depth tutorial on how to get each part set up and running. So in this tutorial, I’m going to be going through each part of the process, step-by-step, so that you can get a similar setup running on your Raspberry Pi.
ADDITIONAL INFORMATION
—————————————————
Visit my blog for the full written tutorial –
PURCHASE LINKS
—————————————————
Raspberry Pi 4b (A Pi 3b/Pi 400/CM4 can also be used) – https://amzn.to/3dYeVqg
Power Supply – https://amzn.to/3EhPts8
ESP32 Microcontroller – https://amzn.to/3obvOV7
MicroUSB Cable – https://amzn.to/32oxy54
Grove Sensor’s From Beginner Kit – https://amzn.to/31my42U
Breadboard – https://amzn.to/3lnrqAB
Breadboard Jumpers – https://amzn.to/3xFop3f
Equipment Used
Portable Monitor (Shown at the end) – https://amzn.to/3n4Lk3X
Some of the above parts are affiliate links. By purchasing products through the above links, you’ll be supporting this channel, with no additional cost to you.
CHAPTERS
—————————————————
0:00 Intro
0:55 Setting Up The ESP32 & Sensors
2:45 Sending Our Sensor Data To InfluxDB
6:35 Creating Our InfluxDB Database
11:06 Installing Grafana On Our Raspberry Pi
14:45 Creating Our Weather Dashboard
18:01 Resizing The Dashboard For Fullscreen Mode
18:35 Final Thoughts
If you’ve got any ideas for Raspberry Pi, Arduino, or other Electronics projects or tutorials you’d like to see, let me know in the comments section.
#influxdb #raspberrypi #grafana #esp32
source